What Does It Do?

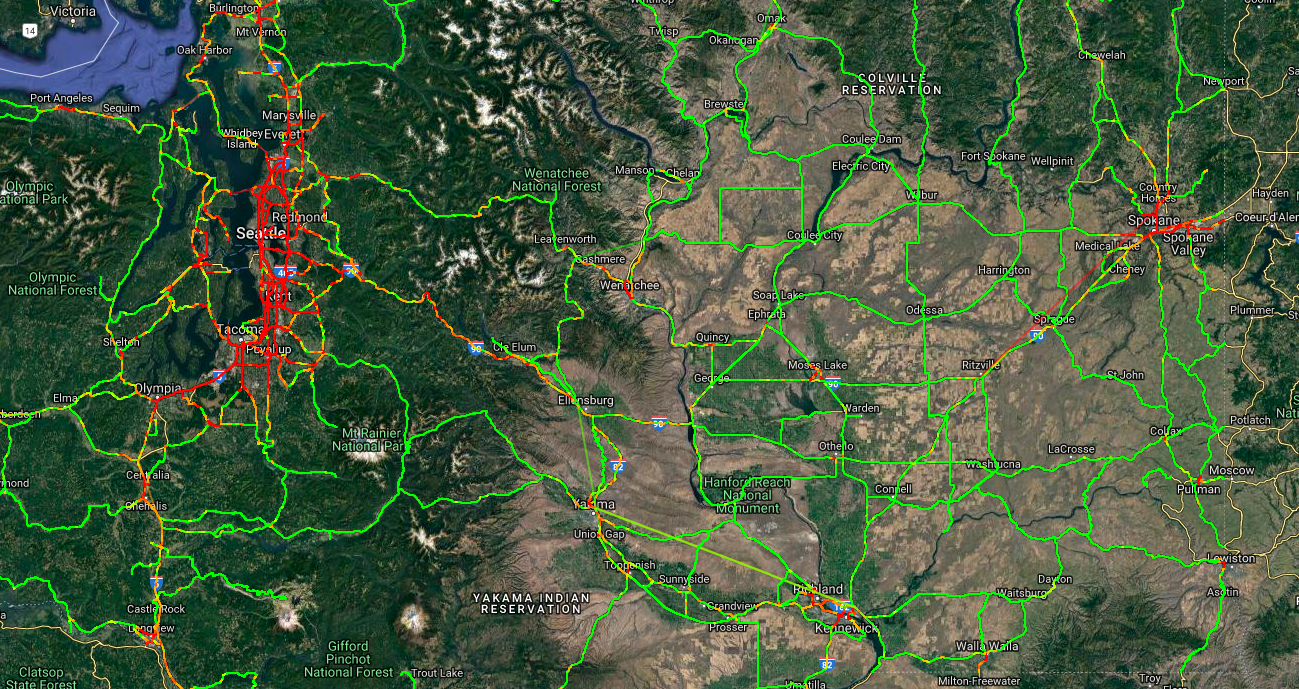
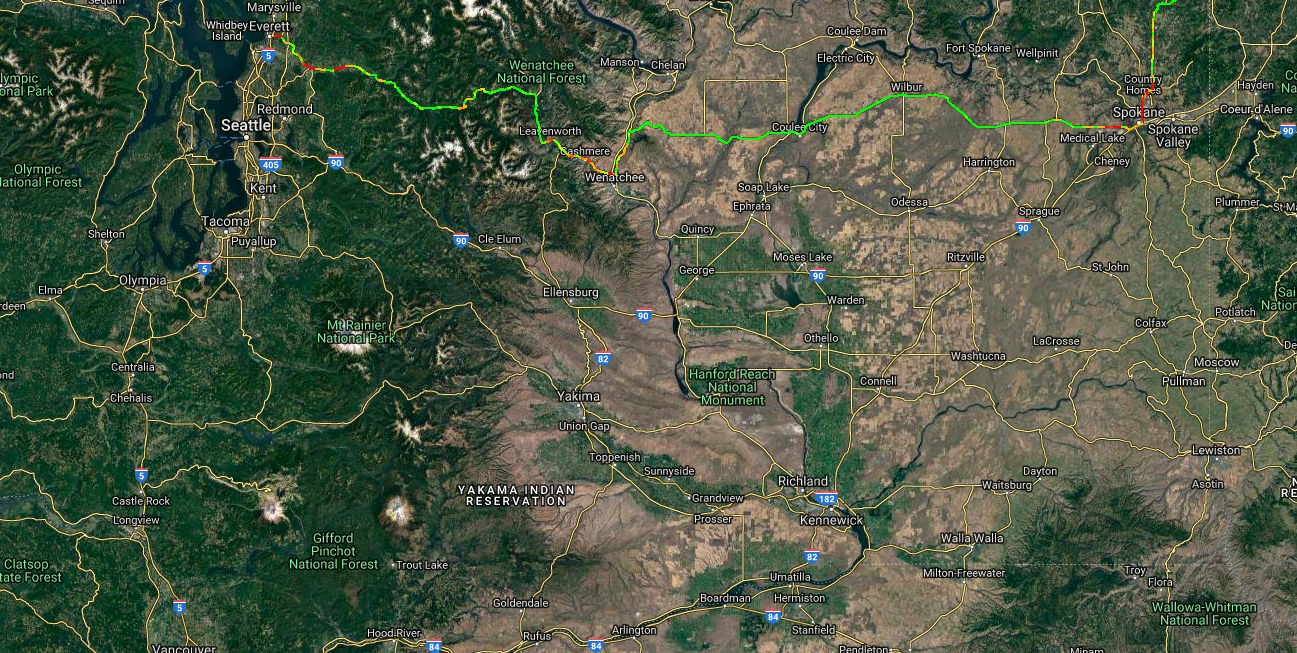
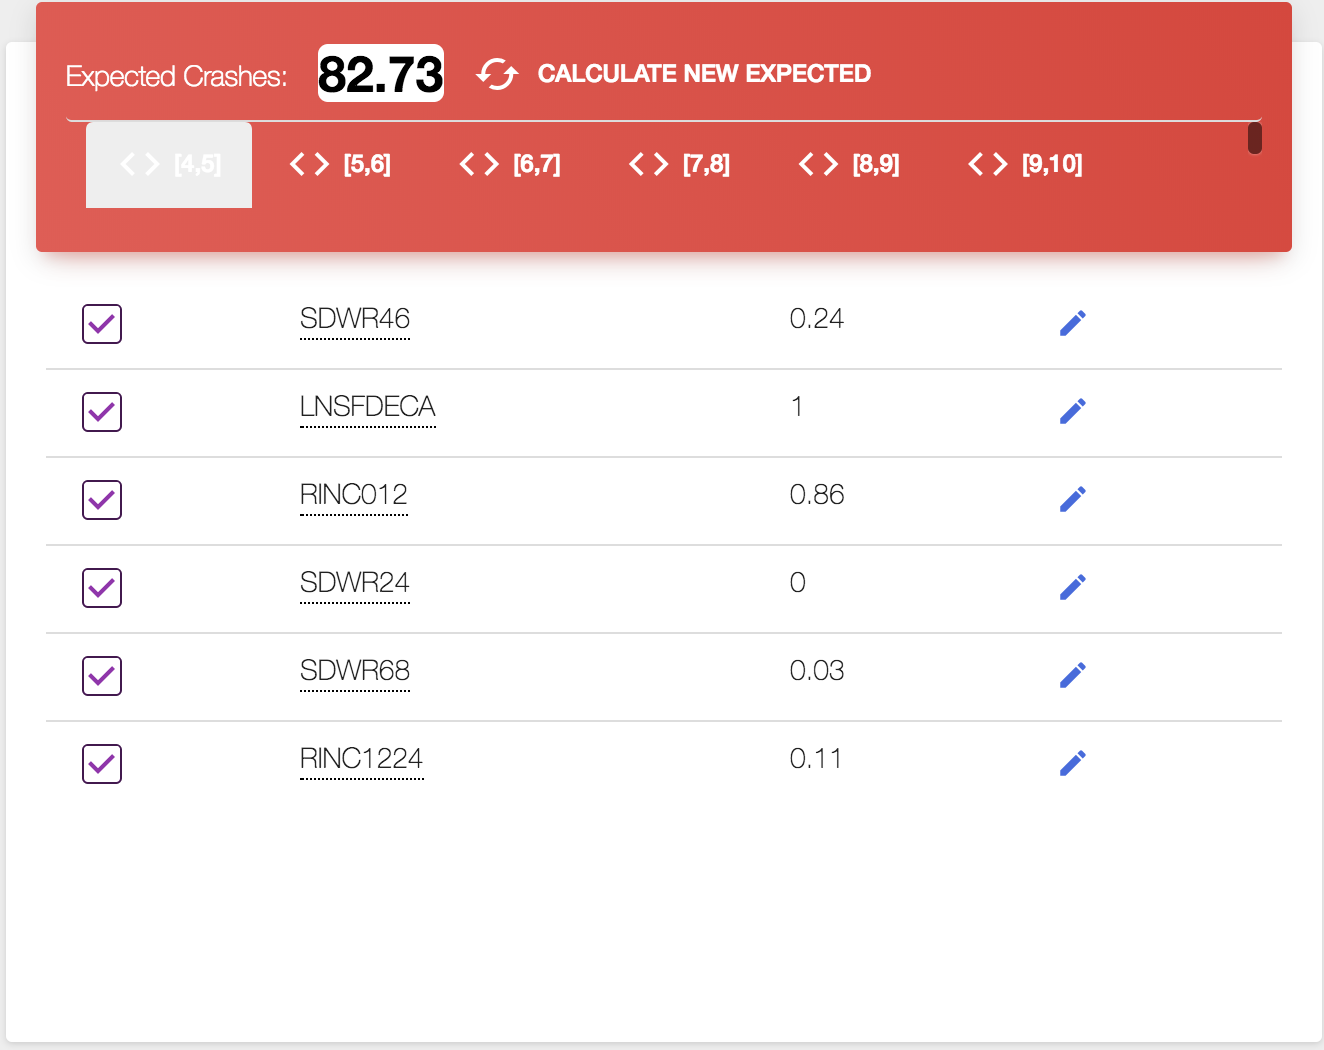
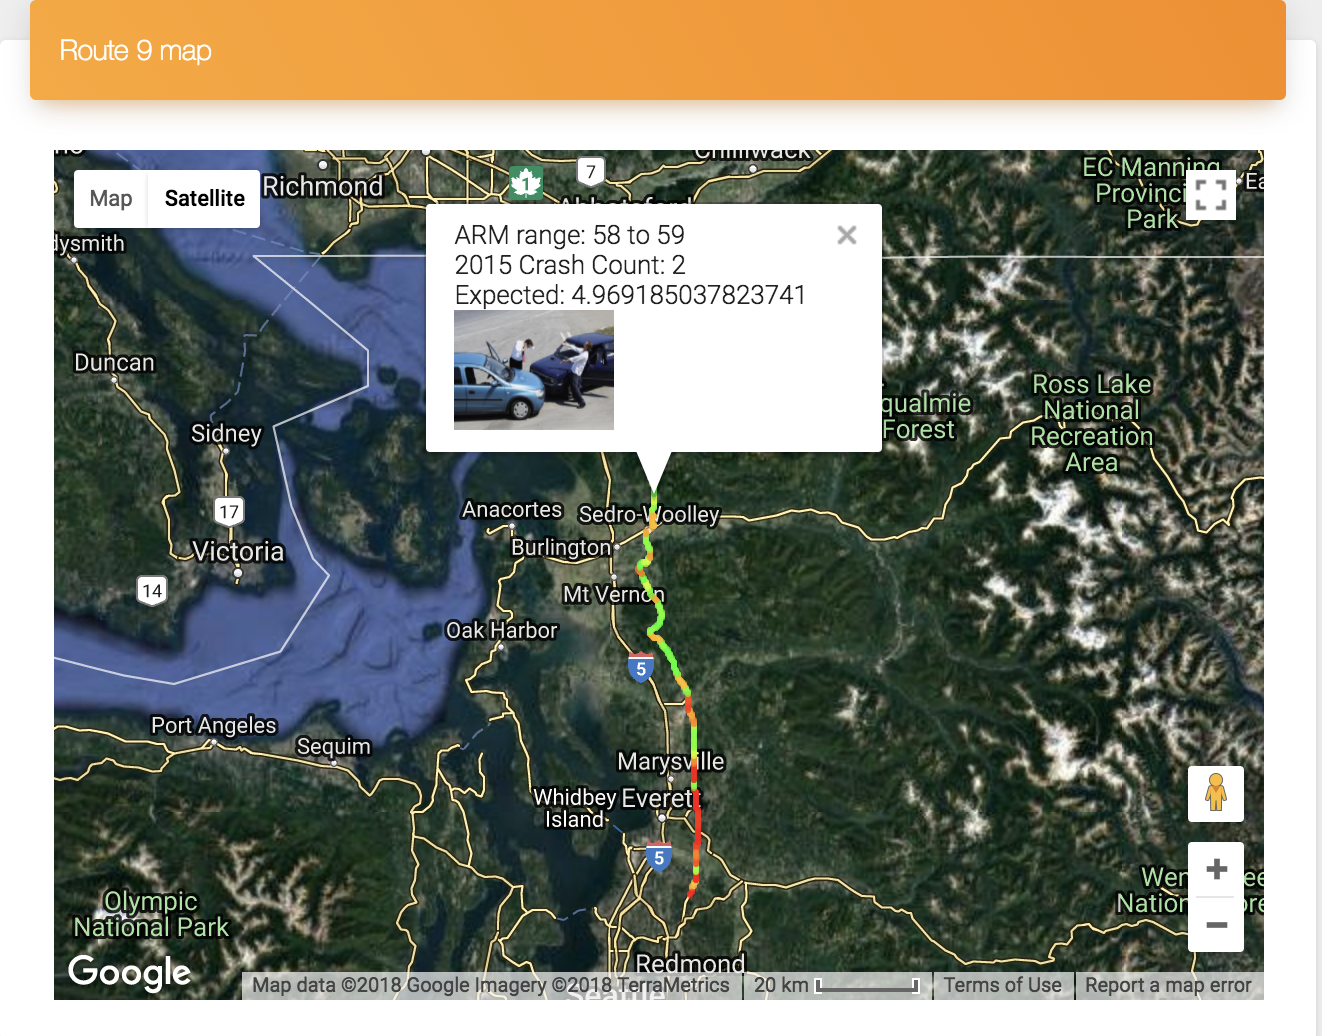
The Visualization Systems allows for users to visualize current crash data on a specific portion of road. With that they are able to better understand the road and how different road attributes contribute to crashes. This system allows State Transportation employees to make better decisions about future construction.

What Else?

What Else?

Users can choose a route to view a heat map displaying the number of accidents on that route in 2014 / 2015. Users can also select beginning and end arms to zoom in on a smaller portion of the route. A plane graph comparison of attributes is displayed upon selection. Users can select routes, and start and end arms.

System Documentation

You can find system documentation on our Google Drive.

How We Did It

We built a REST API on our Django server that pulled the data from Washington State's research database. We processed this data, taking only what we needed because the dataset was very large. Then we served this data to the client on page load. Once the data was into the client we were able to display it appropriately and make recalculations clientside.

Meet The Devs

Meet The Developers

Try the Safety Visualization System

Access to this software is restricted. Please contact us below to make a request. Questions or concerns are welcome.